
Solar-plus-battery energy storage system design
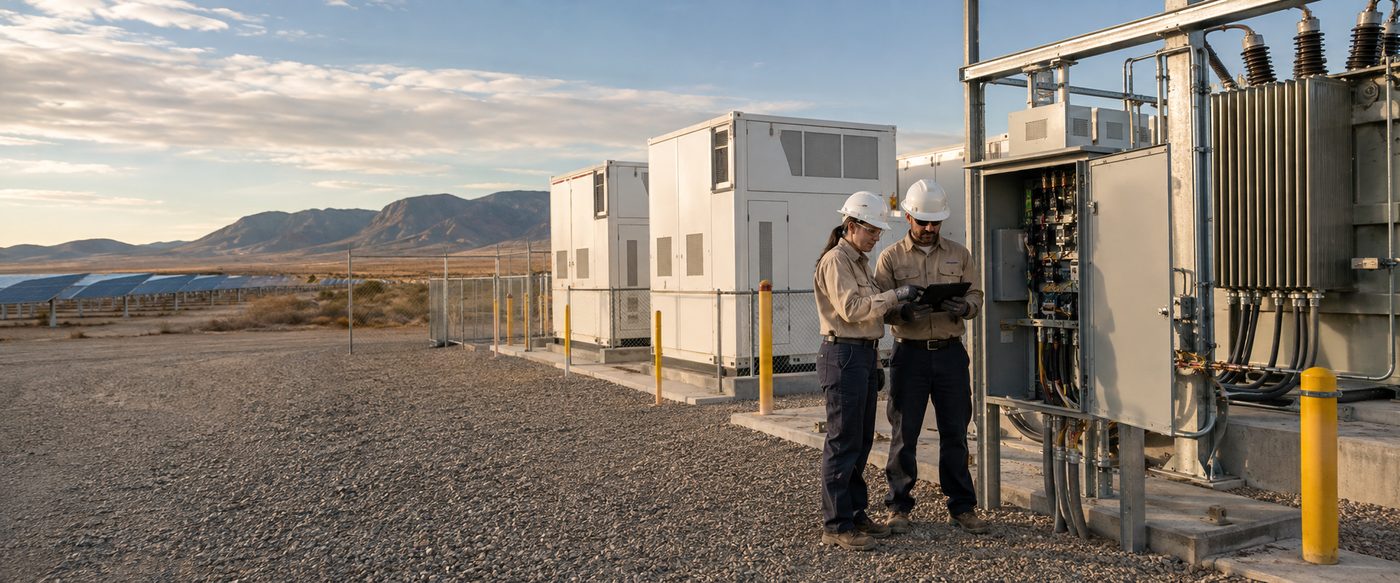
An industrial owner, developer and microgrid integrator serving a Southern California industrial campus with a constrained utility export limit.
- Input received
- Interval load data, tariff and demand-charge structure, PV production model and loss budget, the site plan and fire-access constraints, and battery/PCS/transformer vendor data with the utility interconnection agreement.
- Delivered
- A PV/BESS sizing report and interval dispatch workbook, battery-block and PCS/transformer/switchgear layouts, AC/DC one-lines and protection concept, EMS mode definitions, a code-compliance matrix, and a degradation/augmentation plan.
- Timeline
- Ten Pathworks production weeks after approved load data, tariff, site plan, utility criteria and vendor basis. Excludes AHJ, fire-authority and utility review cycles.
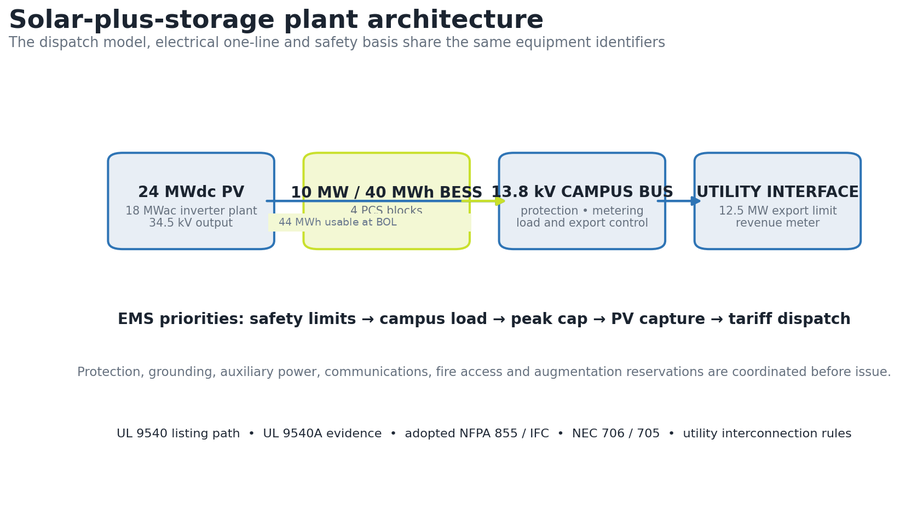
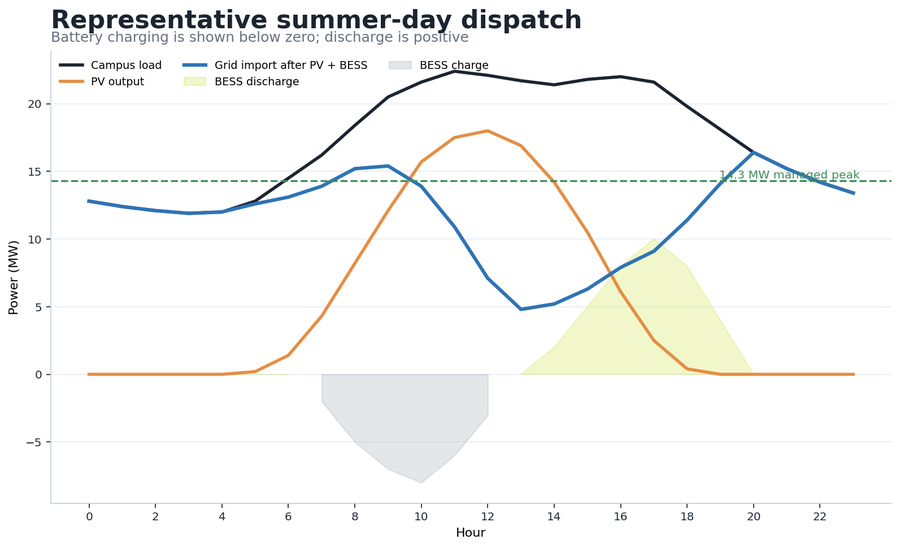
Dispatch assumptions are carried into an equipment-level model so a financial dispatch curve is never issued as an electrical design without a safe, traceable equipment path. The representative design combines 24.001 MWdc of single-axis tracker PV with a 10 MW BESS carrying 44 MWh usable at beginning of life against a 40 MWh guaranteed usable commitment: campus peak falls from 22.4 MW to 14.3 MW, curtailed PV drops from 7.8 GWh to 1.6 GWh, and PV capture rises from 81.8% to 96.3% (approximately 94.4% delivered after 87% round-trip efficiency).
- Solar array
- 24 MWdc
- Battery power
- 10 MW
- Usable energy
- 40 MWh
- Curtailment cut
- 79.5%
The engineering problem
The campus can host more PV than the utility export limit and daytime load can absorb, so a PV-only solution clips or curtails energy during strong solar hours while the facility still experiences a late-afternoon demand peak. The design must coordinate energy dispatch with physical battery blocks, PCS ratings, transformer loading, protection, grounding, auxiliary power, communications, fire access and vendor degradation, because a financial dispatch curve cannot be issued as an electrical design until each operating state has a safe and traceable equipment path.
Design parameters and calculation basis
| PV nameplate | 40,680 modules × 590 W = 24.001 MWdc, single-axis tracker ground mount |
|---|---|
| PV AC | 12 inverter stations × 1.5 MW = 18.0 MWac |
| PV DC/AC | 24.001 ÷ 18.0 = 1.333 |
| BESS rating | 10 MW discharge / 40 MWh usable; 4-hour duration |
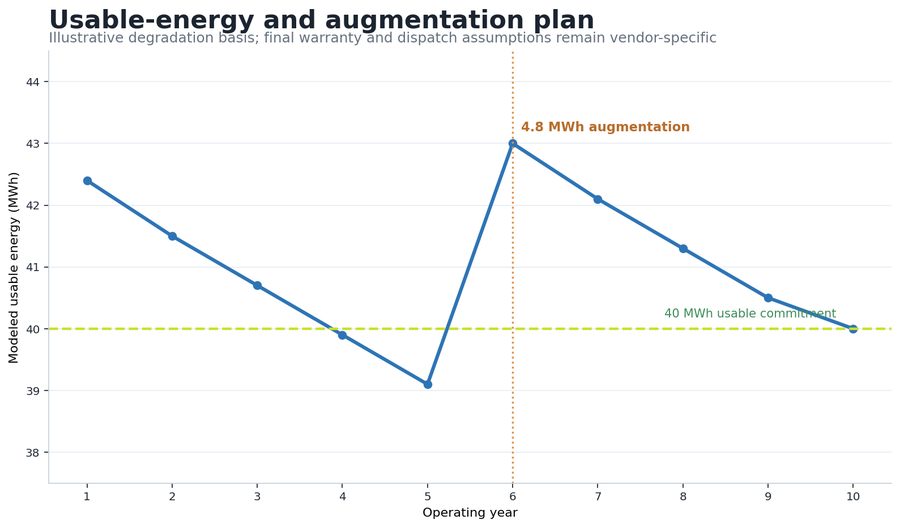
| Initial energy | 44 MWh usable at beginning of life; ≈48.9 MWh installed nameplate at a 90% state-of-charge window |
| Round-trip efficiency | 87% AC-to-AC representative planning value |
| Peak result | 22.4 MW − 8.1 MW = 14.3 MW managed peak |
| Curtailment | 7.8 GWh − 1.6 GWh = 6.2 GWh / 79.5% reduction |
Key design decisions
A four-hour BESS is selected because the peak and curtailment windows overlap for multiple hours; a one- or two-hour system cannot satisfy both objectives consistently. Four 2.5 MW PCS blocks are used so maintenance or a single-block outage does not remove all dispatch capability. Approximately 48.9 MWh of nameplate is installed to give 44 MWh usable at beginning of life, with a year-6 augmentation area reserved so the 40 MWh guaranteed usable commitment holds through year 10 under the representative degradation curve. Safety and utility export limits are prioritized above tariff dispatch in the EMS hierarchy, and UL 9540A evidence, fire access and OEM spacing are treated as design inputs rather than notes added after the block layout is frozen.
Design and quantity control
| Operating measure | PV only | PV + BESS | Representative outcome |
|---|---|---|---|
| Campus peak | 22.4 MW | 14.3 MW | 8.1 MW reduction |
| PV generation | 42.8 GWh | 42.8 GWh | Same resource basis |
| PV curtailed | 7.8 GWh | 1.6 GWh | 6.2 GWh / 79.5% reduced |
| PV captured (before storage loss) | 35.0 GWh | 41.2 GWh | 81.8% → 96.3% captured; ≈94.4% delivered after 87% round-trip |
| Usable energy | — | 40 MWh | Year-6 augmentation reserved |
QA steps and evidence
| QA gate | Acceptance test | Evidence / result |
|---|---|---|
| Energy balance | PV, load, charge, discharge, losses and curtailment reconcile | 42.8 GWh PV / 1.6 GWh residual curtailment |
| Power balance | PCS, transformer and export limits checked in every mode | 10 MW BESS / 12.5 MW export cap |
| Safety basis | Listing and fire-code evidence indexed | UL 9540 / 9540A register |
| Usable energy | Degradation and augmentation maintain commitment | ≥40 MWh through year 10 |
| Issue control | Dispatch IDs match equipment and one-line IDs | Four coordinated releases |
Revision record
| Release | Trigger | Change made | Controlled outcome |
|---|---|---|---|
| Concept | Load and PV time series | Selected 10 MW / 40 MWh four-hour architecture | Peak and curtailment objectives both served |
| 30% | Vendor and fire inputs | Reoriented blocks; added separation and access | Code pathway established |
| 60% | Utility and protection review | Updated transformer, metering and export controls | Interconnection basis reconciled |
| Issued support | Warranty and augmentation review | Reserved 4.8 MWh year-6 addition | 40 MWh usable commitment protected |
Result and calculation trail
The representative design combines 24.001 MWdc of single-axis tracker PV with a 10 MW / 40 MWh BESS. Under the illustrative interval model, the campus peak falls from 22.4 MW to 14.3 MW, curtailed PV drops from 7.8 GWh to 1.6 GWh, and PV capture rises from 81.8% to 96.3% — approximately 94.4% delivered to load after 87% round-trip efficiency — while a year-6 augmentation preserves usable energy.
PV DC capacity: 40,680 × 590 W = 24.001 MWdc. BESS duration: 40 MWh ÷ 10 MW = 4.0 hours. Peak reduction: 22.4 − 14.3 = 8.1 MW, or 36.2%. Curtailment reduction: (7.8 − 1.6) ÷ 7.8 = 79.5%.
Pathworks developed a representative 24 MWdc solar-plus-storage design for an industrial campus with a constrained export limit; the 10 MW / 40 MWh BESS coordinates peak shaving, PV capture, safety, one-lines, protection, EMS modes and augmentation in one controlled design package.
More case studies
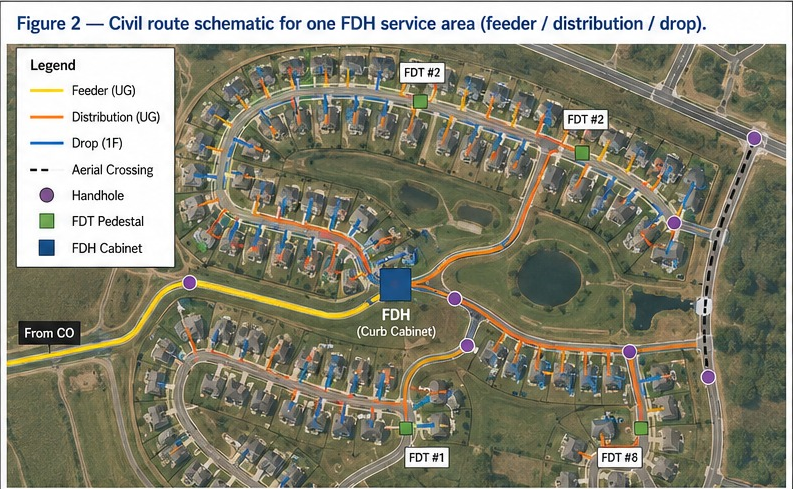

Greenfield FTTH design for 500 homes, full OSP package from plat to BOM
Built to standard US ILEC/CLEC practice: a two-stage 1:4/1:8 split localizes fault response to a single FDT instead of the whole feeder, construction runs underground-first to meet HOA aesthetic requirements, and 20–30% spare fiber is held at every tier so the network can absorb infill lots without a re-trench. The design closes with 7.4 dB of optical margin against the 28 dB GPON Class B+ budget, enough headroom for a future 1:64 upgrade at a subset of FDTs.
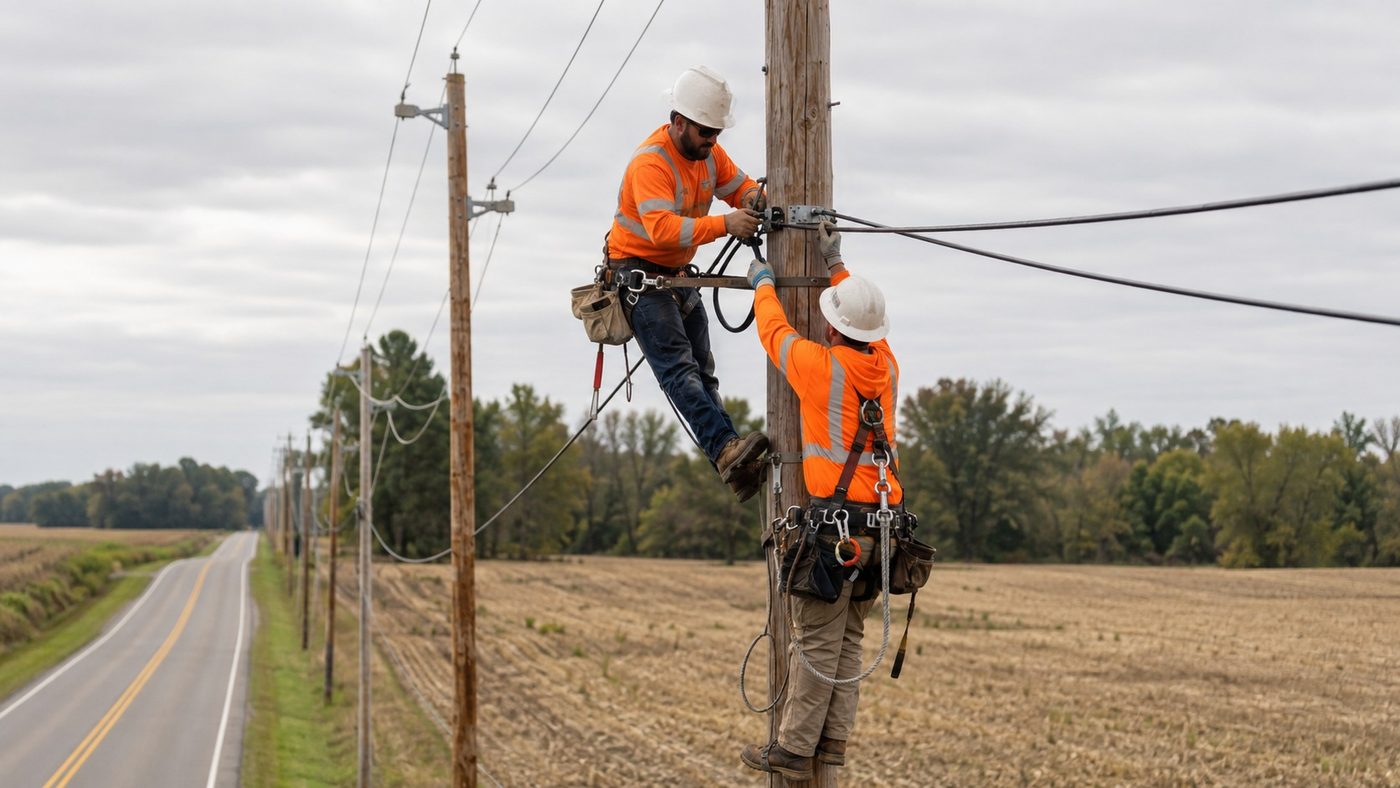
Rural greenfield FTTH design for a 500-location BEAD service area
A two-stage 1:32 split architecture assigns all 500 approved locations to complete XGS-PON paths across 512 terminal ports. Route optimization reduces the seed alignment from 35.7 to 33.0 miles, a 7.6% reduction, while the modeled planning cost falls from $9,460 to $8,940 per passing and the worst modeled path retains 4.74 dB of N2 optical margin.
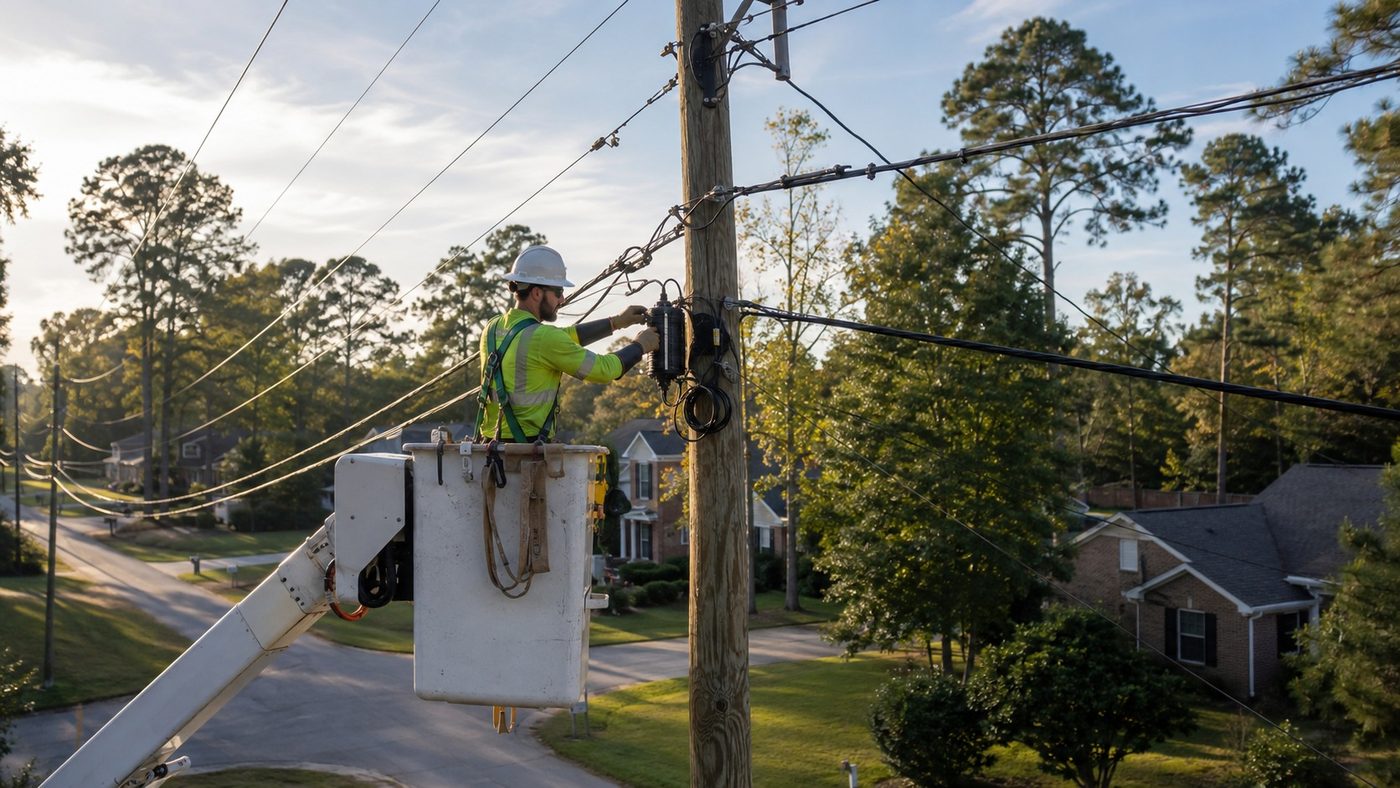
Aerial FTTH design and pole make-ready analysis
A pole-by-pole evidence record separates clean attachment candidates from conditions that require transfer, rearrangement, guying review or replacement. The modeled review identifies 226 make-ready or data conflicts across 1,946 poles; design adjustments resolve 141 before application packaging, including 15 avoided pole-replacement candidates, reaching 92% first-submission readiness.