
Wind-farm repowering and electrical balance-of-plant design
A wind owner/operator, developer and repowering EPC replacing an aging fleet across the Iowa / Great Plains region.
- Input received
- Existing as-builts, GIS, cable schedules and relay settings, current survey and turbine coordinates, new turbine power-curve and equipment data, and collection/substation load-flow and fault data.
- Delivered
- An asset-disposition register, repowered turbine/access-road/crane-pad plans, 34.5 kV collection and grounding drawings, substation-interface one-lines and equipment schedules, and demolition/cutover work packages.
- Timeline
- Twelve Pathworks production weeks after survey, condition, geotechnical, turbine, collection and interconnection inputs. Excludes utility, outage-approval and OEM certification cycles.
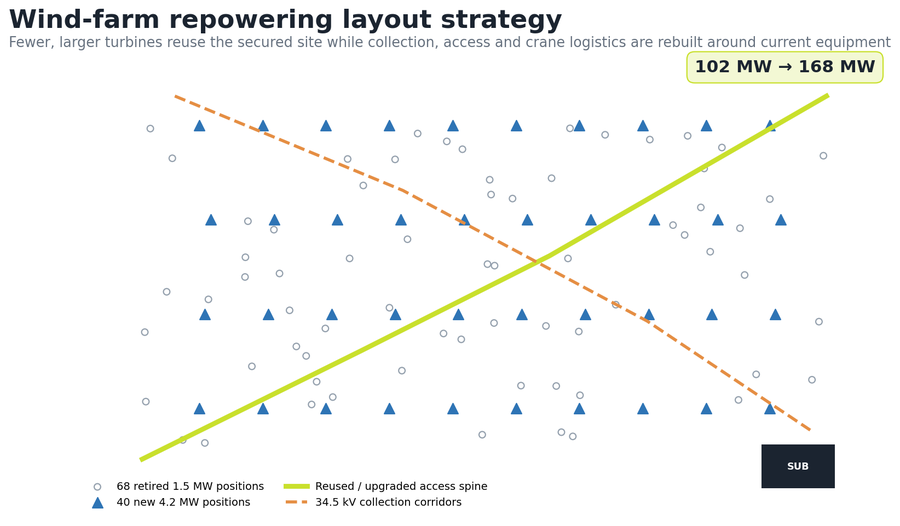
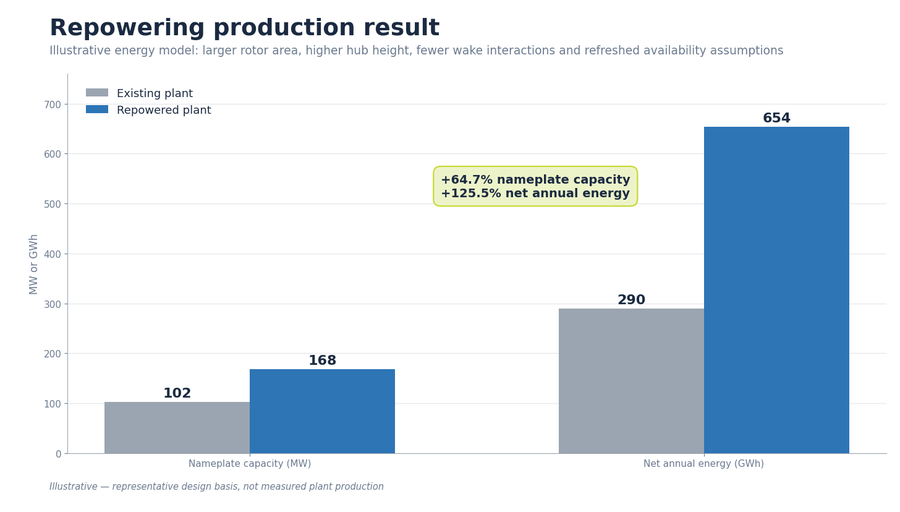
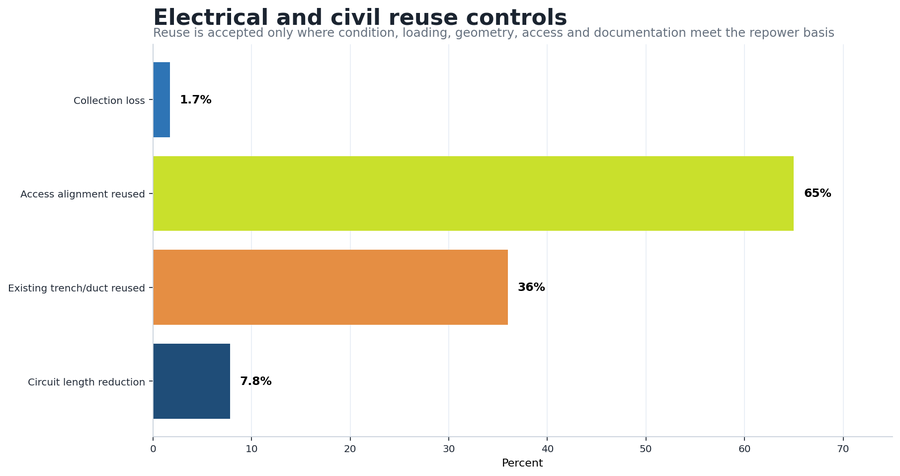
A retained/modify/replace disposition is built for every existing asset, using the same asset IDs across the turbine plan, access design, collection circuits, substation interface and demolition package. The representative full repower replaces 68 × 1.5 MW turbines with 40 × 4.2 MW units, raising capacity from 102 MW to 168 MW and net annual energy from 290 GWh to 654 GWh while retaining 65% of access alignment and 36% of trench/duct corridors.
- Turbine count
- 68 → 40
- Capacity
- 102 → 168 MW
- Net annual energy
- 654 GWh
- Life extension
- 25 years
The engineering problem
The existing plant has secured land, roads, a substation and 34.5 kV collection, but those assets were designed around smaller turbines and an older operations basis. New machines change wake spacing, foundation loads, crane logistics, feeder power, fault duty, protection, transformer loading and the location of every cable termination. Repowering value depends on disciplined reuse: existing roads, ducts, trenches, cables and substation equipment are retained only where condition, capacity, geometry and records support the new duty, since unsupported reuse transfers cost and outage risk to construction.
Design parameters and calculation basis
| Existing plant | 68 × 1.5 MW = 102 MW |
|---|---|
| Repowered plant | 40 × 4.2 MW (≈150 m rotor, 100 m hub height, ≈238 W/m² specific power) = 168 MW |
| Capacity increase | 66 MW / 64.7% |
| Net annual energy | 290 GWh → 654 GWh / 125.5% increase |
| Collection loss | 2.6% → 1.7% of gross production |
| Collection length | 47.2 circuit-mi → 43.5 circuit-mi / 7.8% reduction |
| Reuse | 65% access-road alignment; 15.8 mi of the 43.5 circuit-mi repowered route / 36% trench or duct corridor |
| Life extension | 25 years projected, subject to turbine, civil and electrical certification |
Key design decisions
Full repowering is used because larger rotor and hub-height gains justify fewer turbines and a renewed design life; partial component replacement does not meet the representative energy target. Road alignment is retained where geometry and drainage can be upgraded, but curves are widened and segments reinforced for the new transport envelope. Trench or duct corridors are reused only after survey, cable condition and capacity checks — a mapped route is never treated as automatically reusable electrical plant. Eight 34.5 kV feeders are rebuilt around 21 MW nominal groups to control ampacity, voltage drop, outage exposure and sectionalizing — each group draws approximately 351 A at 34.5 kV, sized on 1,000 kcmil aluminum with direct-buried derating applied — and the existing substation transformer is replaced with a 200 MVA unit with breakers, bus, protection and grounding revalidated against the new duty.
Design and quantity control
| Asset / measure | Existing | Repowered | Controlled outcome |
|---|---|---|---|
| Turbines | 68 × 1.5 MW | 40 × 4.2 MW | 102 → 168 MW |
| Net annual energy | 290 GWh | 654 GWh | +364 GWh / 125.5% |
| Collection loss | 2.6% | 1.7% | 0.9 percentage-point reduction |
| Circuit length | 47.2 mi | 43.5 mi | 3.7 mi / 7.8% removed |
| Reuse | Legacy roads / trenches | 65% road / 36% corridor | Condition-based disposition |
QA steps and evidence
| QA gate | Acceptance test | Evidence / result |
|---|---|---|
| Existing records | Asset IDs and routes reconcile to evidence | 284 drawings / schedules indexed |
| Turbine layout | OEM, property, access and wake constraints applied | 40 controlled positions |
| Collection | Ampacity, voltage drop and feeder grouping checked | Eight 34.5 kV feeders |
| Reuse | Condition and capacity disposition recorded | 65% road / 36% corridor reuse |
| Issue control | Demolition, new work and cutover agree | Three design releases + as-built conversion |
Revision record
| Release | Trigger | Change made | Controlled outcome |
|---|---|---|---|
| 30% | Record and layout review | Removed unsupported cable reuse; shifted seven turbine sites | Controlled retained / replace basis |
| 60% | Transport and collection review | Upgraded road curves; rebalanced eight feeders | Constructable logistics and electrical plan |
| Issued support | Substation and cutover review | Updated transformer, outage and demolition packages | Repower work packages released |
Result and calculation trail
The representative full repower replaces 68 × 1.5 MW turbines with 40 × 4.2 MW units. Nameplate capacity rises from 102 MW to 168 MW, modeled net annual energy increases from 290 GWh to 654 GWh, collection losses fall from 2.6% to 1.7%, and controlled reuse preserves 65% of access alignment and 36% of trench/duct corridors.
Existing capacity: 68 × 1.5 MW = 102 MW. Repowered capacity: 40 × 4.2 MW = 168 MW. Capacity increase: (168 − 102) ÷ 102 = 64.7%. Net annual energy increase: (654 − 290) ÷ 290 = 125.5%. Collection-length reduction: (47.2 − 43.5) ÷ 47.2 = 7.8%.
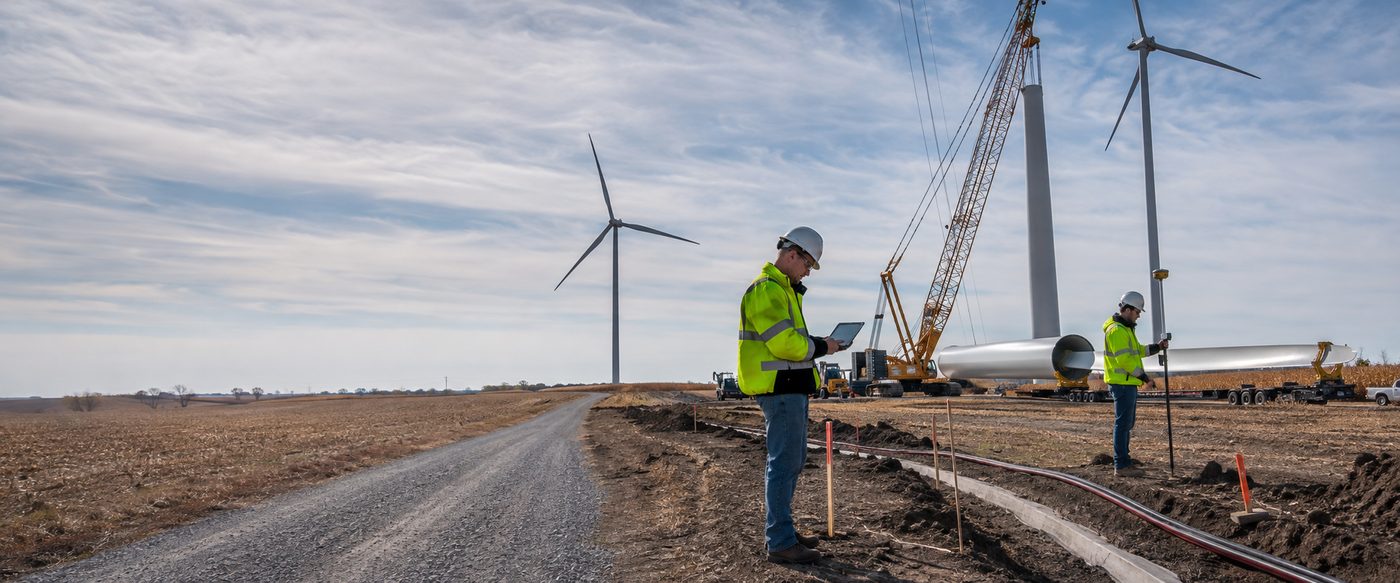
Pathworks developed a representative full-repower design for an aging Great Plains wind plant: the new 168 MW layout coordinates turbine positions, roads, crane pads, 34.5 kV collection, substation upgrades, demolition and cutover while retaining only the existing assets that meet condition and capacity requirements.
More case studies
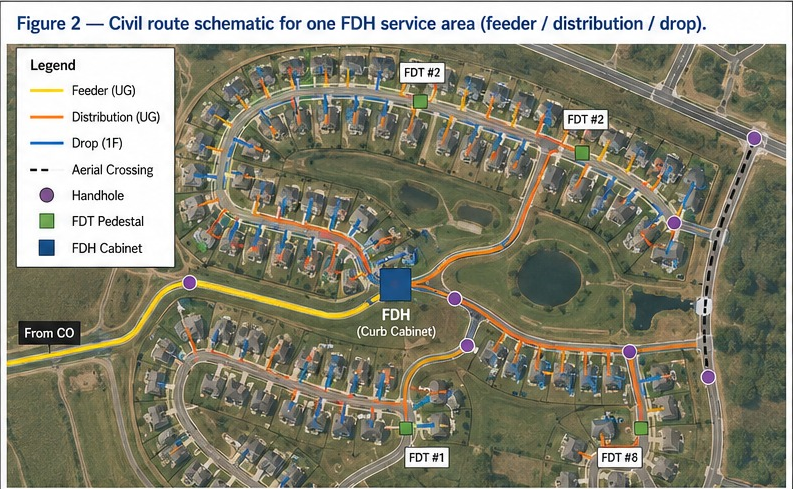

Greenfield FTTH design for 500 homes, full OSP package from plat to BOM
Built to standard US ILEC/CLEC practice: a two-stage 1:4/1:8 split localizes fault response to a single FDT instead of the whole feeder, construction runs underground-first to meet HOA aesthetic requirements, and 20–30% spare fiber is held at every tier so the network can absorb infill lots without a re-trench. The design closes with 7.4 dB of optical margin against the 28 dB GPON Class B+ budget, enough headroom for a future 1:64 upgrade at a subset of FDTs.
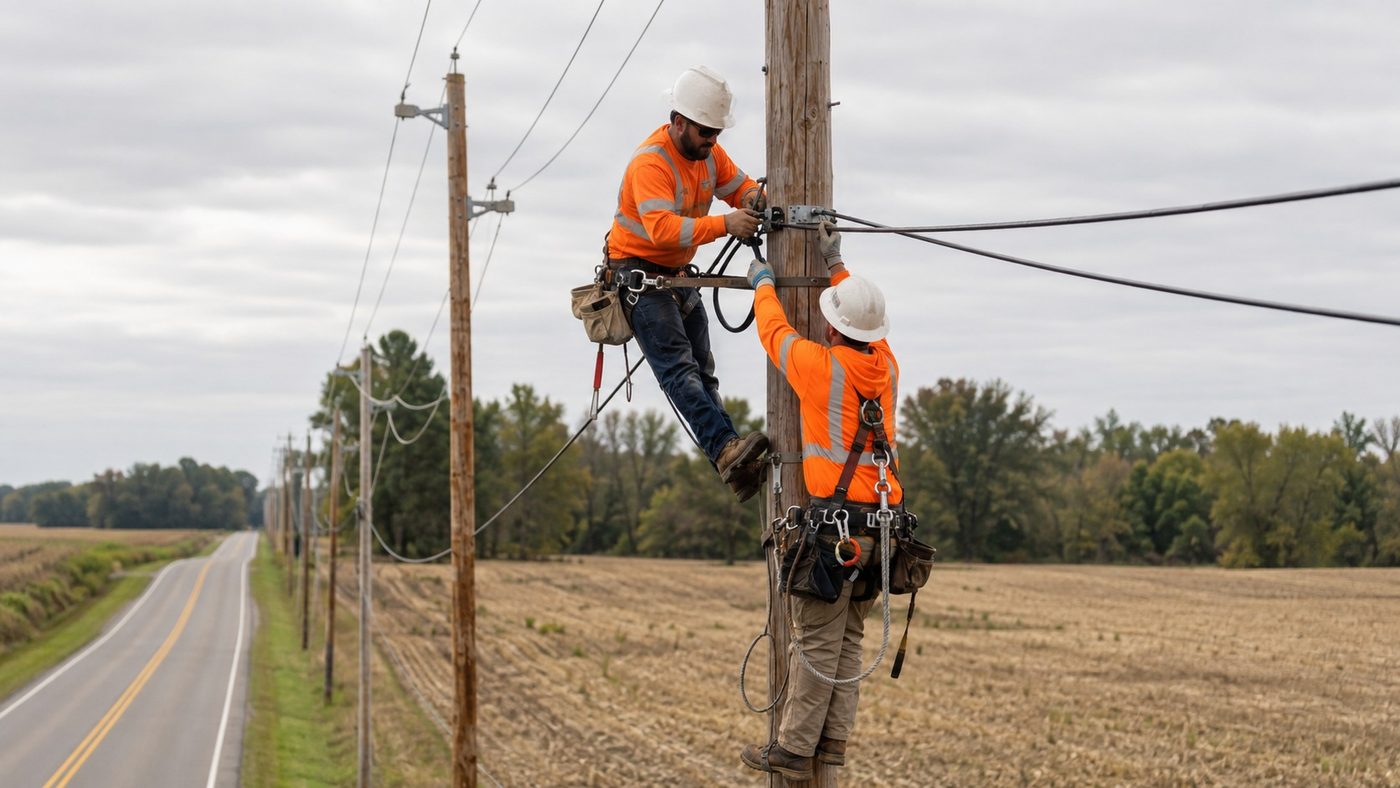
Rural greenfield FTTH design for a 500-location BEAD service area
A two-stage 1:32 split architecture assigns all 500 approved locations to complete XGS-PON paths across 512 terminal ports. Route optimization reduces the seed alignment from 35.7 to 33.0 miles, a 7.6% reduction, while the modeled planning cost falls from $9,460 to $8,940 per passing and the worst modeled path retains 4.74 dB of N2 optical margin.
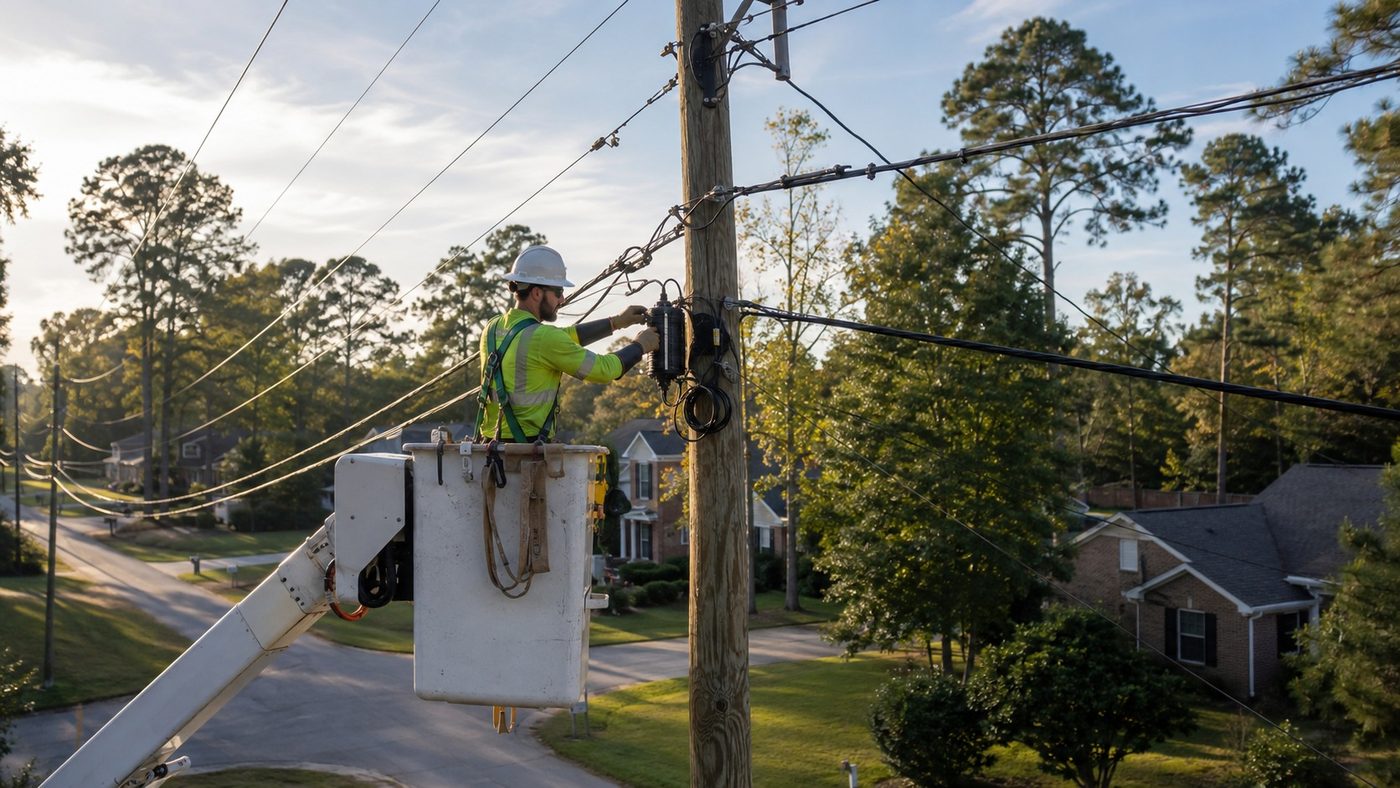
Aerial FTTH design and pole make-ready analysis
A pole-by-pole evidence record separates clean attachment candidates from conditions that require transfer, rearrangement, guying review or replacement. The modeled review identifies 226 make-ready or data conflicts across 1,946 poles; design adjustments resolve 141 before application packaging, including 15 avoided pole-replacement candidates, reaching 92% first-submission readiness.